BACKGROUND: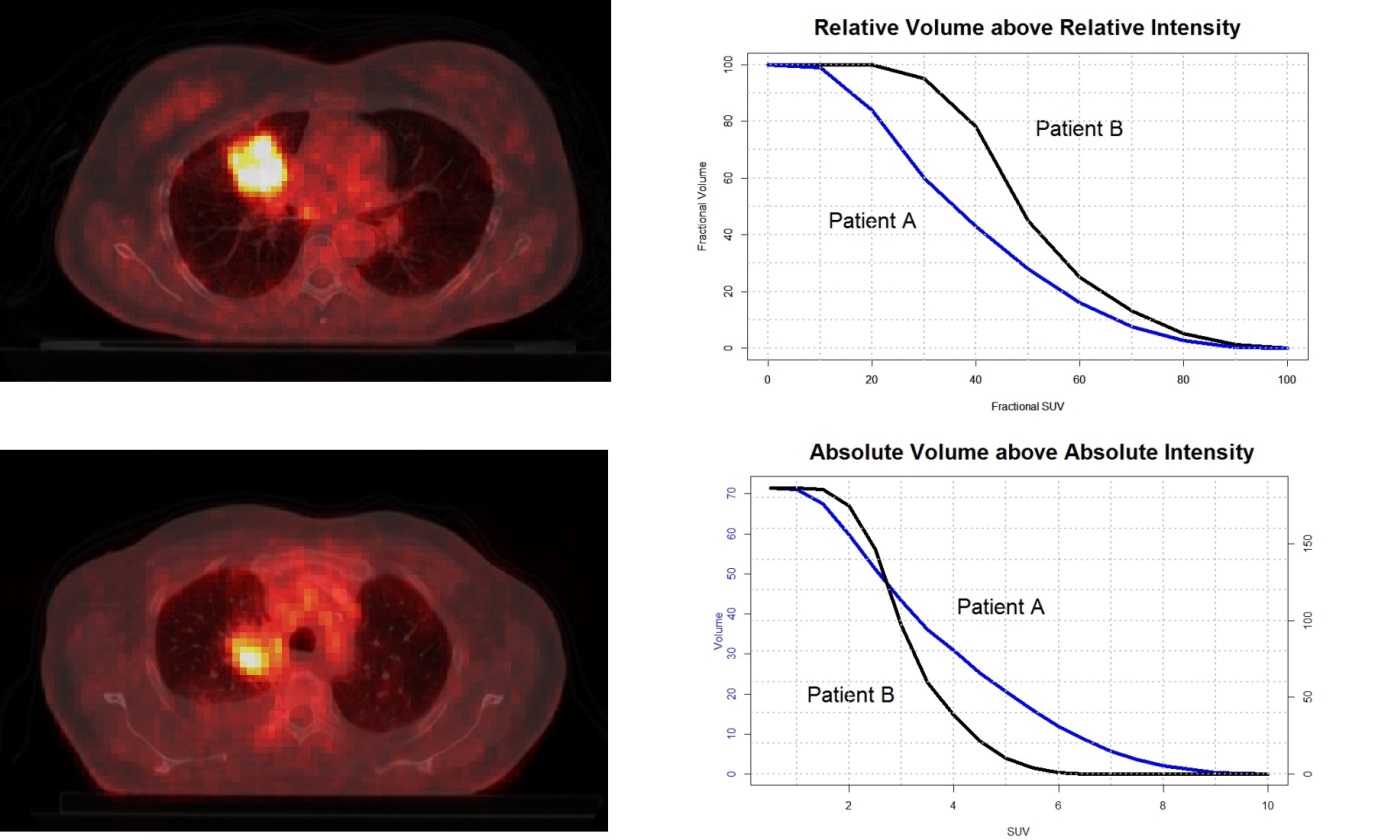
Maximum, mean and peak SUV of primary tumor at baseline FDG-PET scans, have often been found predictive for overall survival in non-small cell lung cancer (NSCLC) patients. In this study we further investigated the prognostic power of advanced metabolic metrics derived from intensity volume histograms (IVH) extracted from PET imaging.
METHODS:
A cohort of 220 NSCLC patients (mean age, 66.6 years; 149 men, 71 women), stages I-IIIB, treated with radiotherapy with curative intent were included (NCT00522639). Each patient underwent standardized pre-treatment CT-PET imaging. Primary GTV was delineated by an experienced radiation oncologist on CT-PET images. Common PET descriptors such as maximum, mean and peak SUV, and metabolic tumor volume (MTV) were quantified. Advanced descriptors of metabolic activity were quantified by IVH. These comprised five groups of features: absolute and relative volume above relative intensity threshold (AVRI and RVRI), absolute and relative volume above absolute intensity threshold (AVAI and RVAI), and absolute intensity above relative volume threshold (AIRV). MTV was derived from the IVH curves for volumes with SUV above 2.5, 3 and 4, and of 40% and 50% maximum SUV. Univariable analysis using Cox Proportional Hazard Regression was performed for overall survival assessment.
RESULTS:
Relative volume above higher SUV (80%) was an independent predictor of OS (p = 0.05). None of the possible surrogates for MTV based on volumes above SUV of 3, 40% and 50% of maximum SUV showed significant associations with OS [p (AVAI3) = 0.10, p (AVAI4) = 0.22, p (AVRI40%) = 0.15, p (AVRI50%) = 0.17]. Maximum and peak SUV (r = 0.99) revealed no prognostic value for OS [p (maximum SUV) = 0.20, p (peak SUV) = 0.22].
CONCLUSIONS:
New methods using more advanced imaging features extracted from PET were analyzed. Best prognostic value for OS of NSCLC patients was found for relative portions of the tumor above higher uptakes (80% SUV).